Project details
Cell geometry, module response, measured loading, build state, and representative programmed motion from the current paper figures.
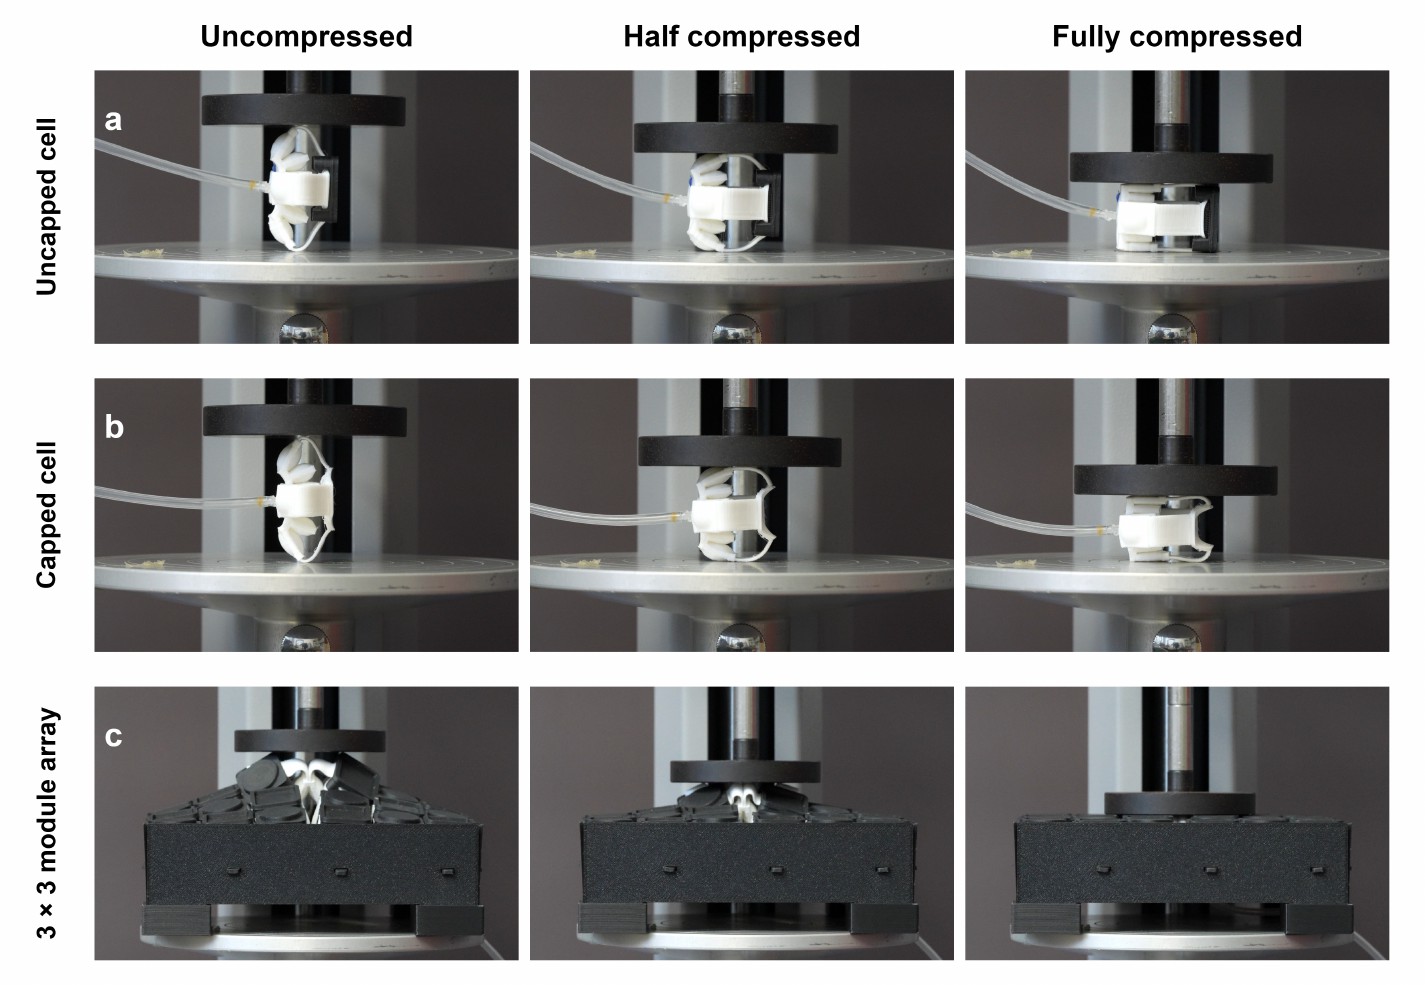
Cell and module response
- Capped and uncapped cells are shown side by side across the same pressure sweep.
- Pressure-driven expansion rotates compliant linkage legs while the integrated chamber supplies deformation.
- The 2 x 2 module test reports single- and two-module bending angles separately.


Measurements
Current paper figures and tables; figure-read values remain approximate.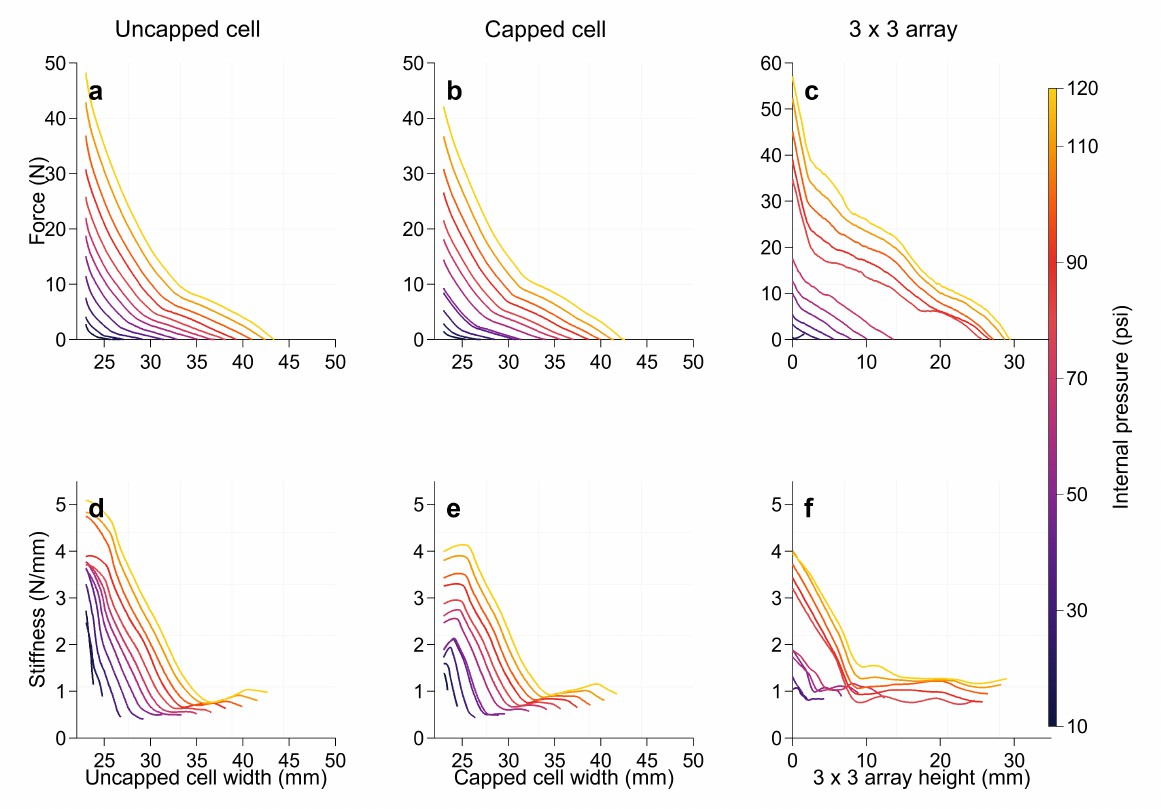
| Output force | Approx. 40-50 N for single-cell tests; above 50 N for the 3 x 3 array near maximum compression. | Fig. 5(a-c) |
|---|---|---|
| Local stiffness | Approx. 5-7 N/mm peak local stiffness across cell and array plots. | Fig. 5(d-f) |
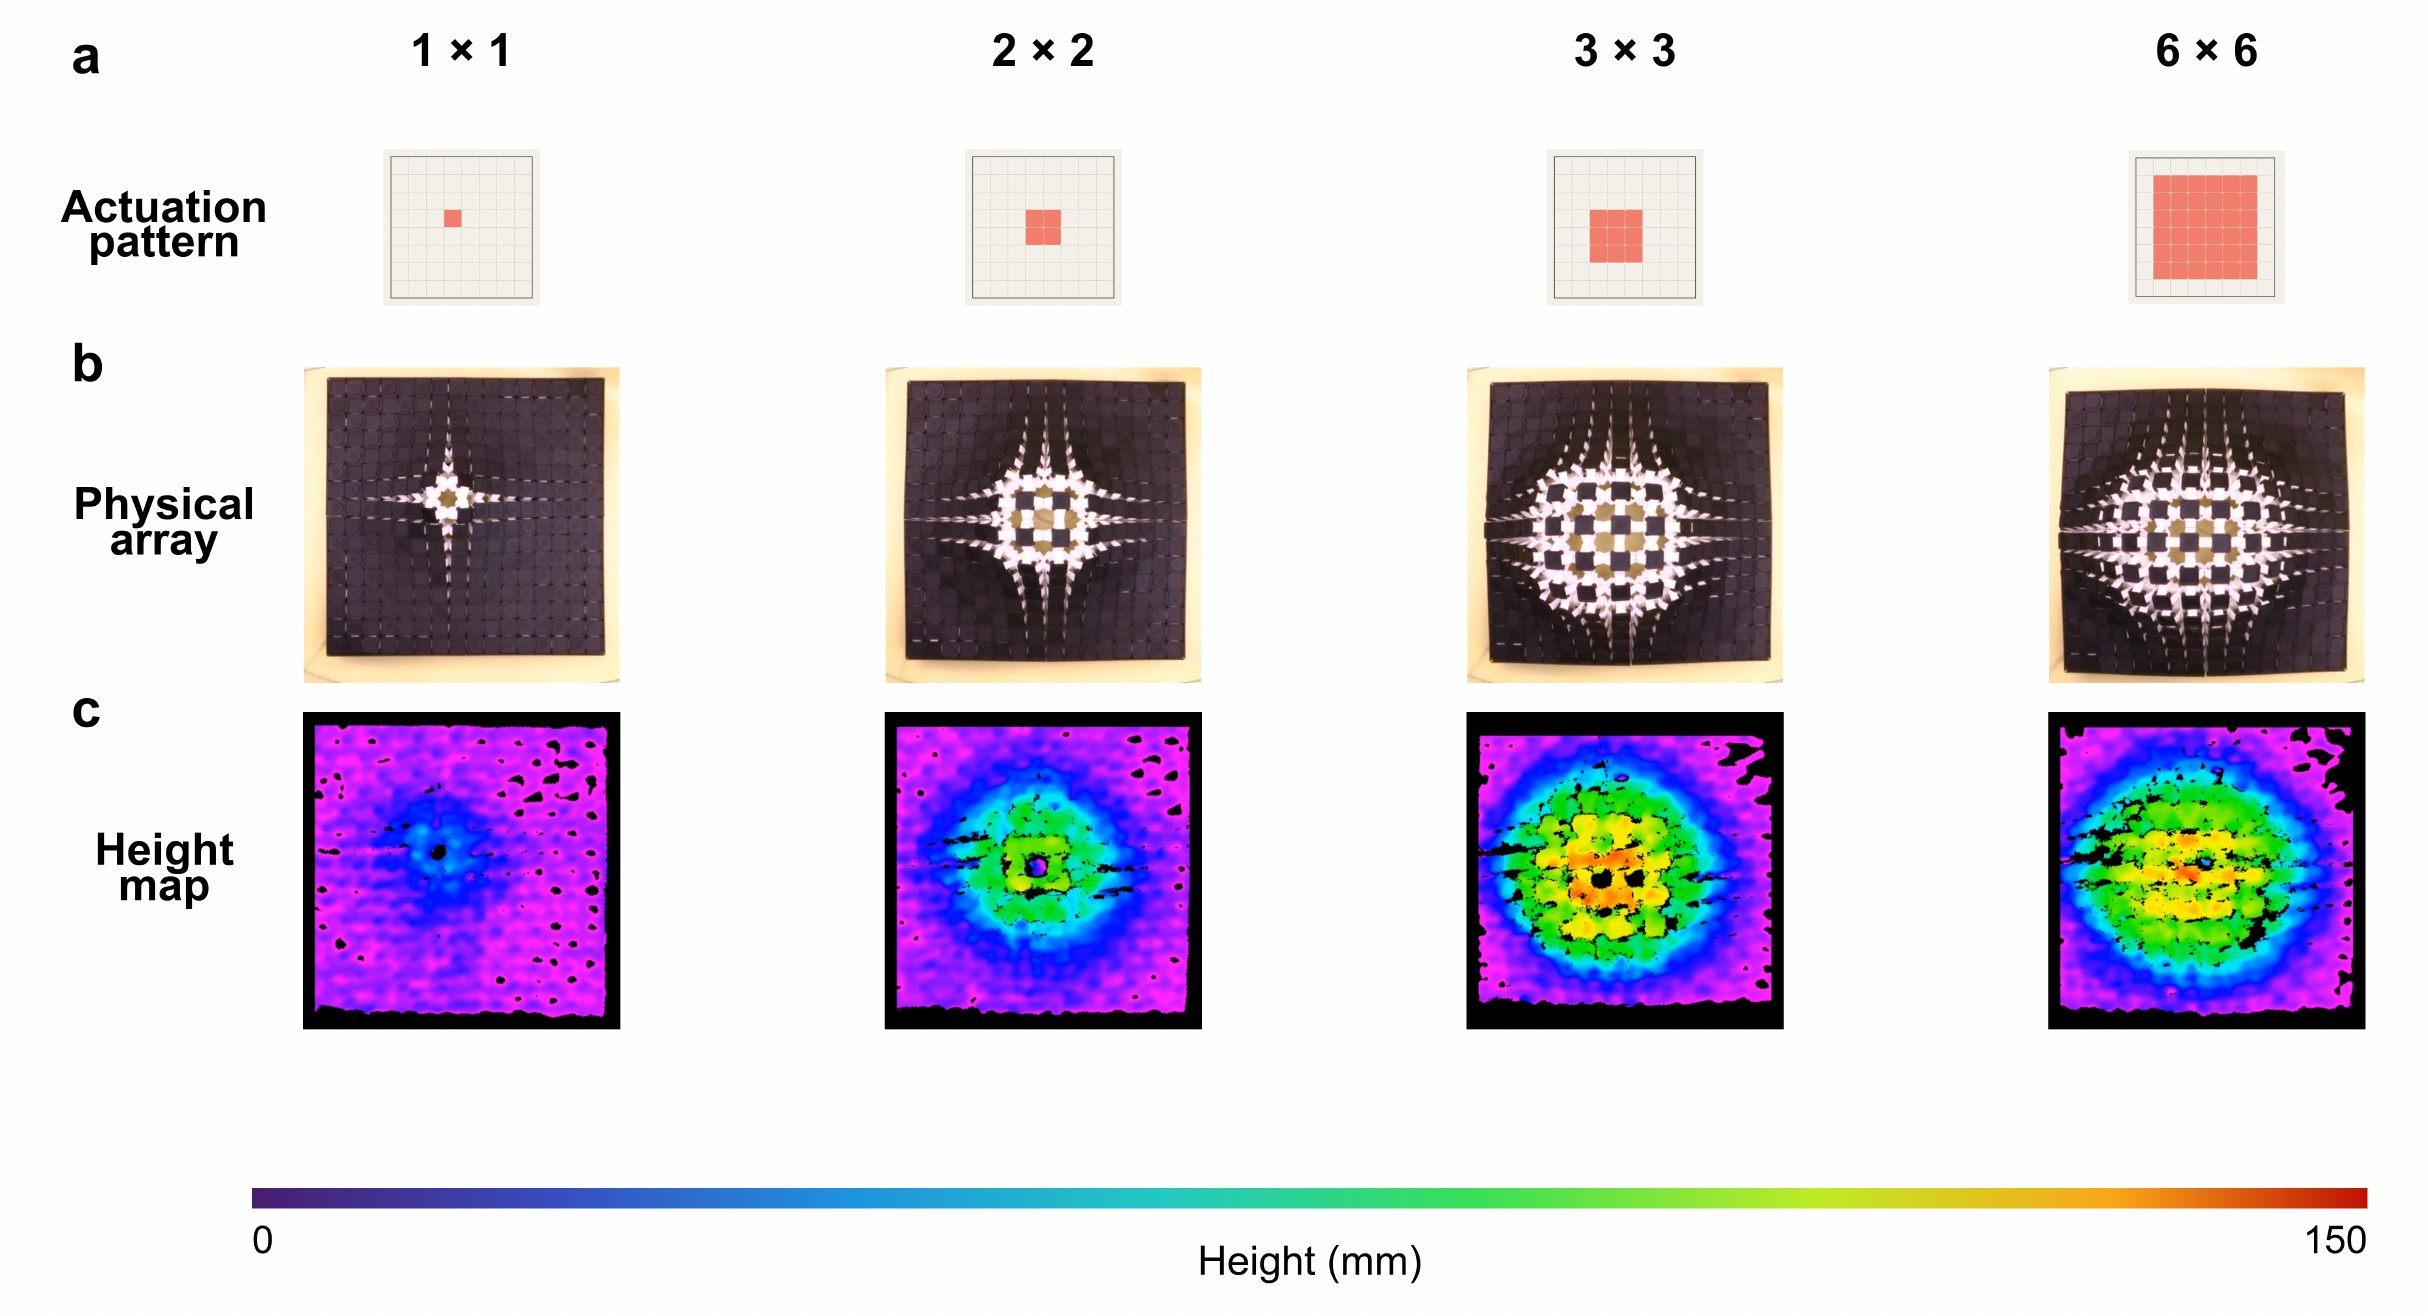
| Planar height | At 100 psi, 1 x 1 actuation reaches 60 mm max height; 2 x 2 actuation reaches 115 mm. | Table 1 |
| Boundary | Loop area is not digitized here; current build remains tethered and manually assembled. | Methods; Discussion |
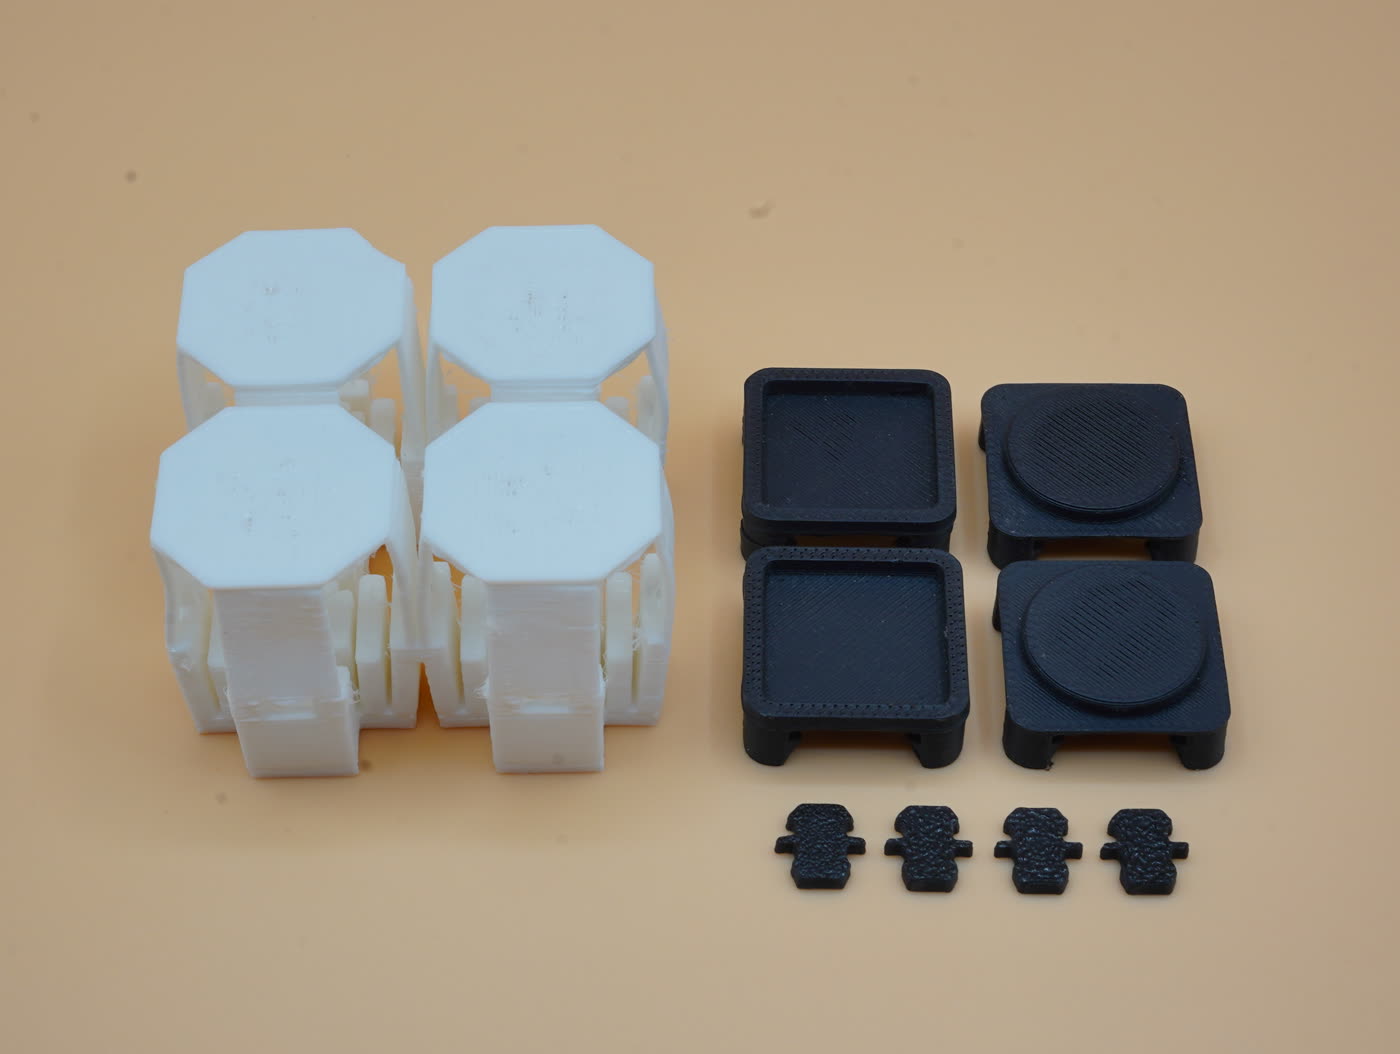
Build and test state
- Printed cell bodies, caps, and snap-fit connectors are shown as physical parts.
- Unit-cell and array load tests precede the surface and body demonstrations.
- Electronic addressing is outside the current public build state.
Programmed motion
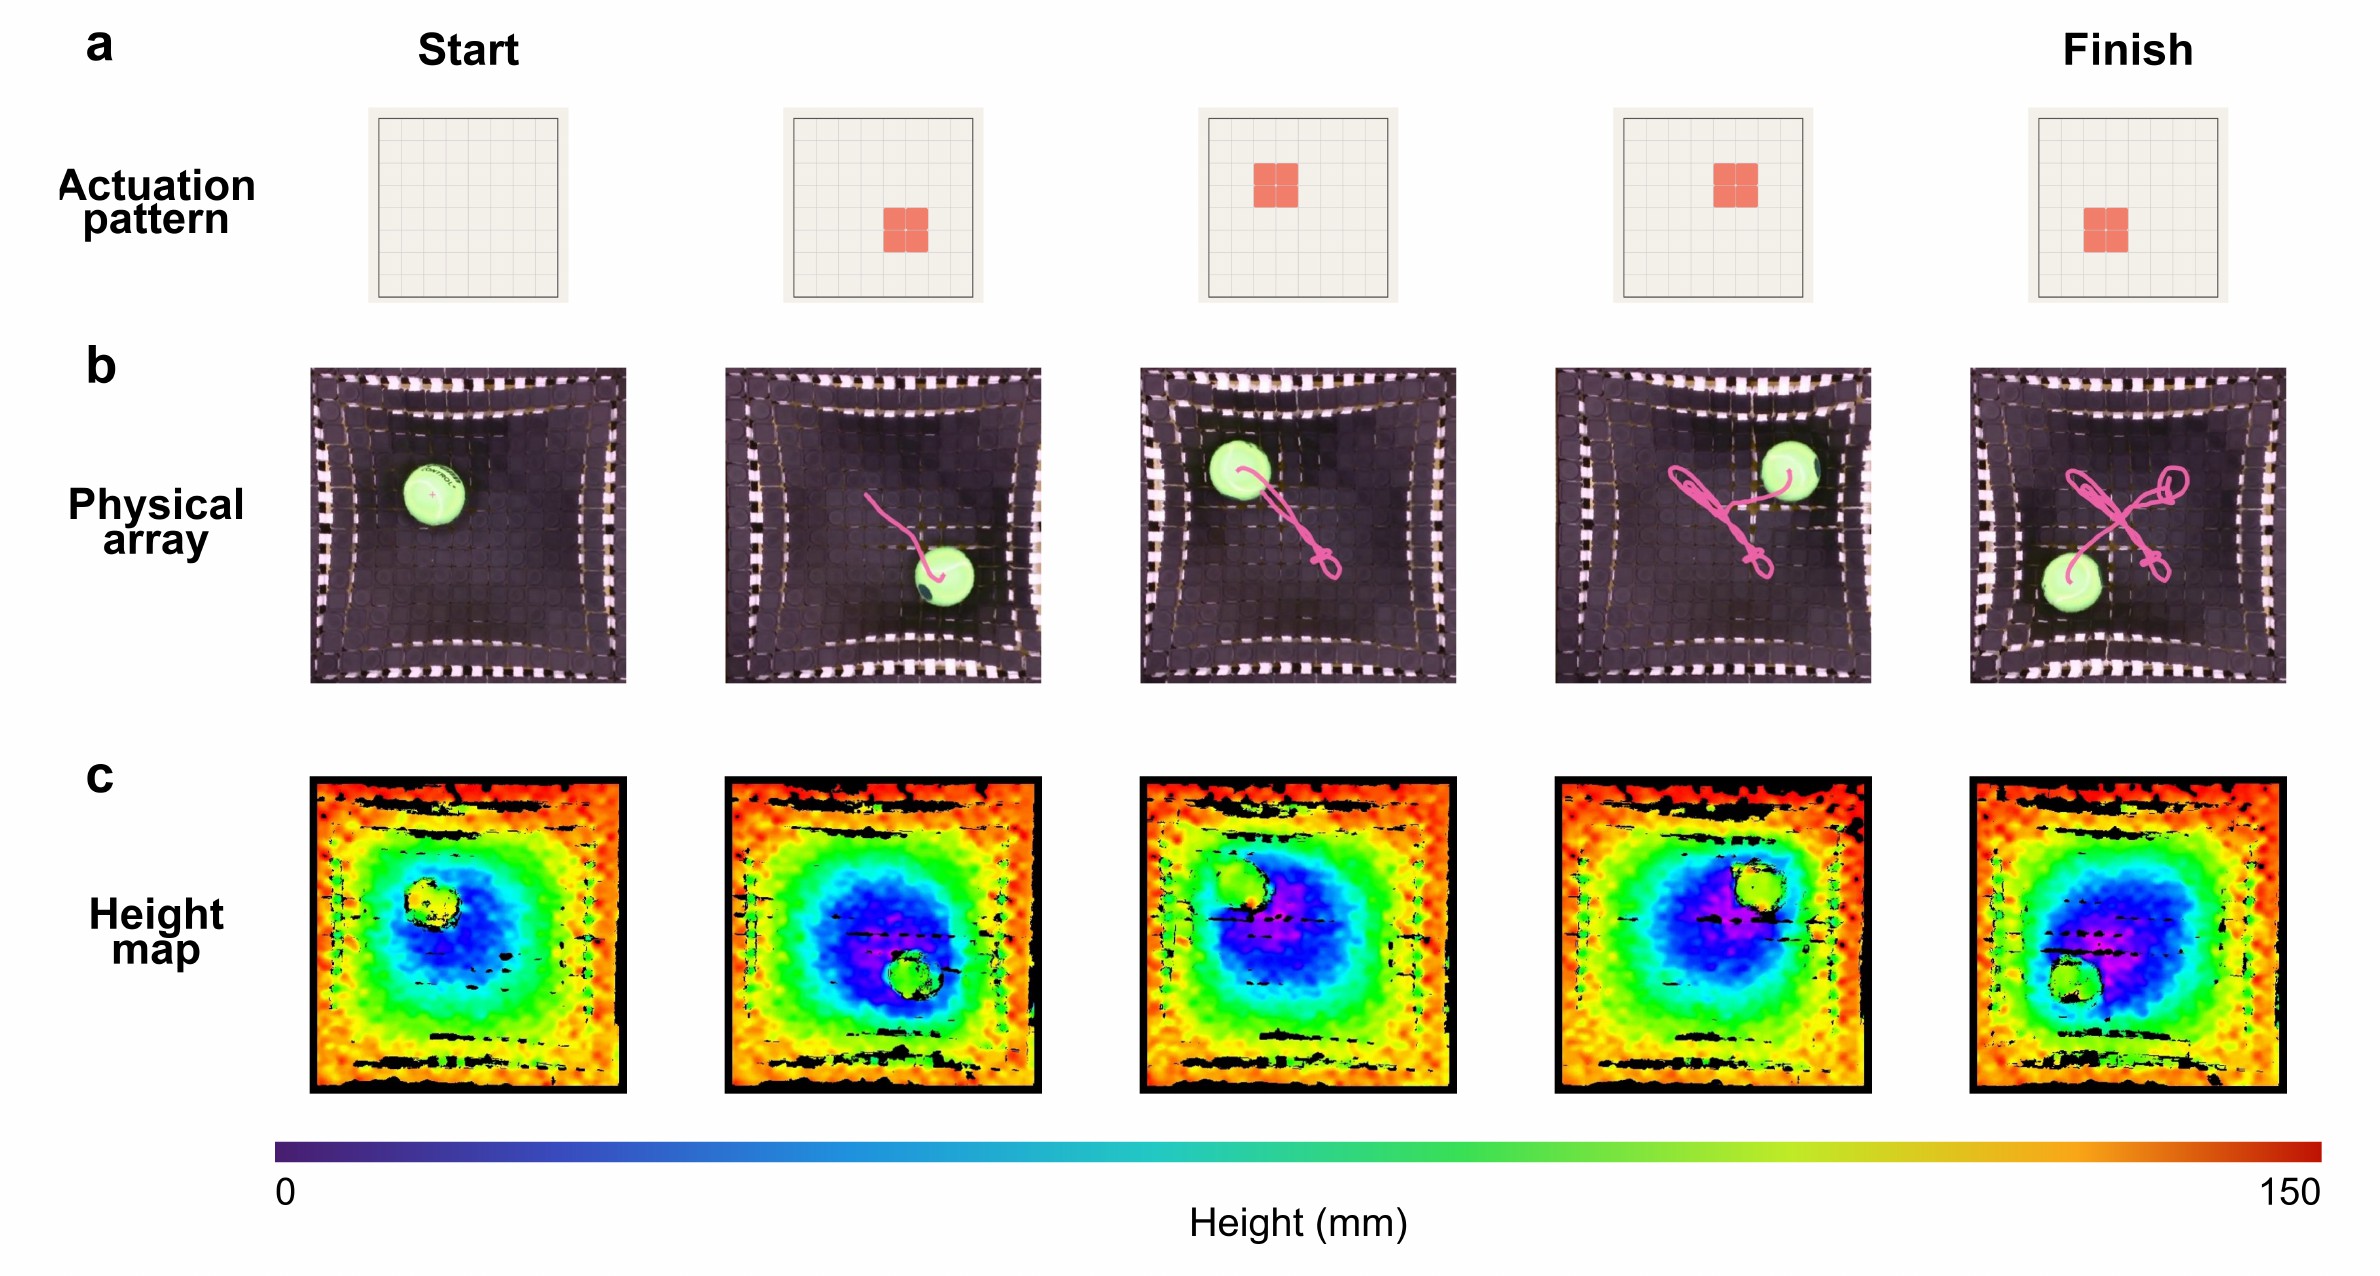
- Local pressure patterns produce measured height maps and object transport.
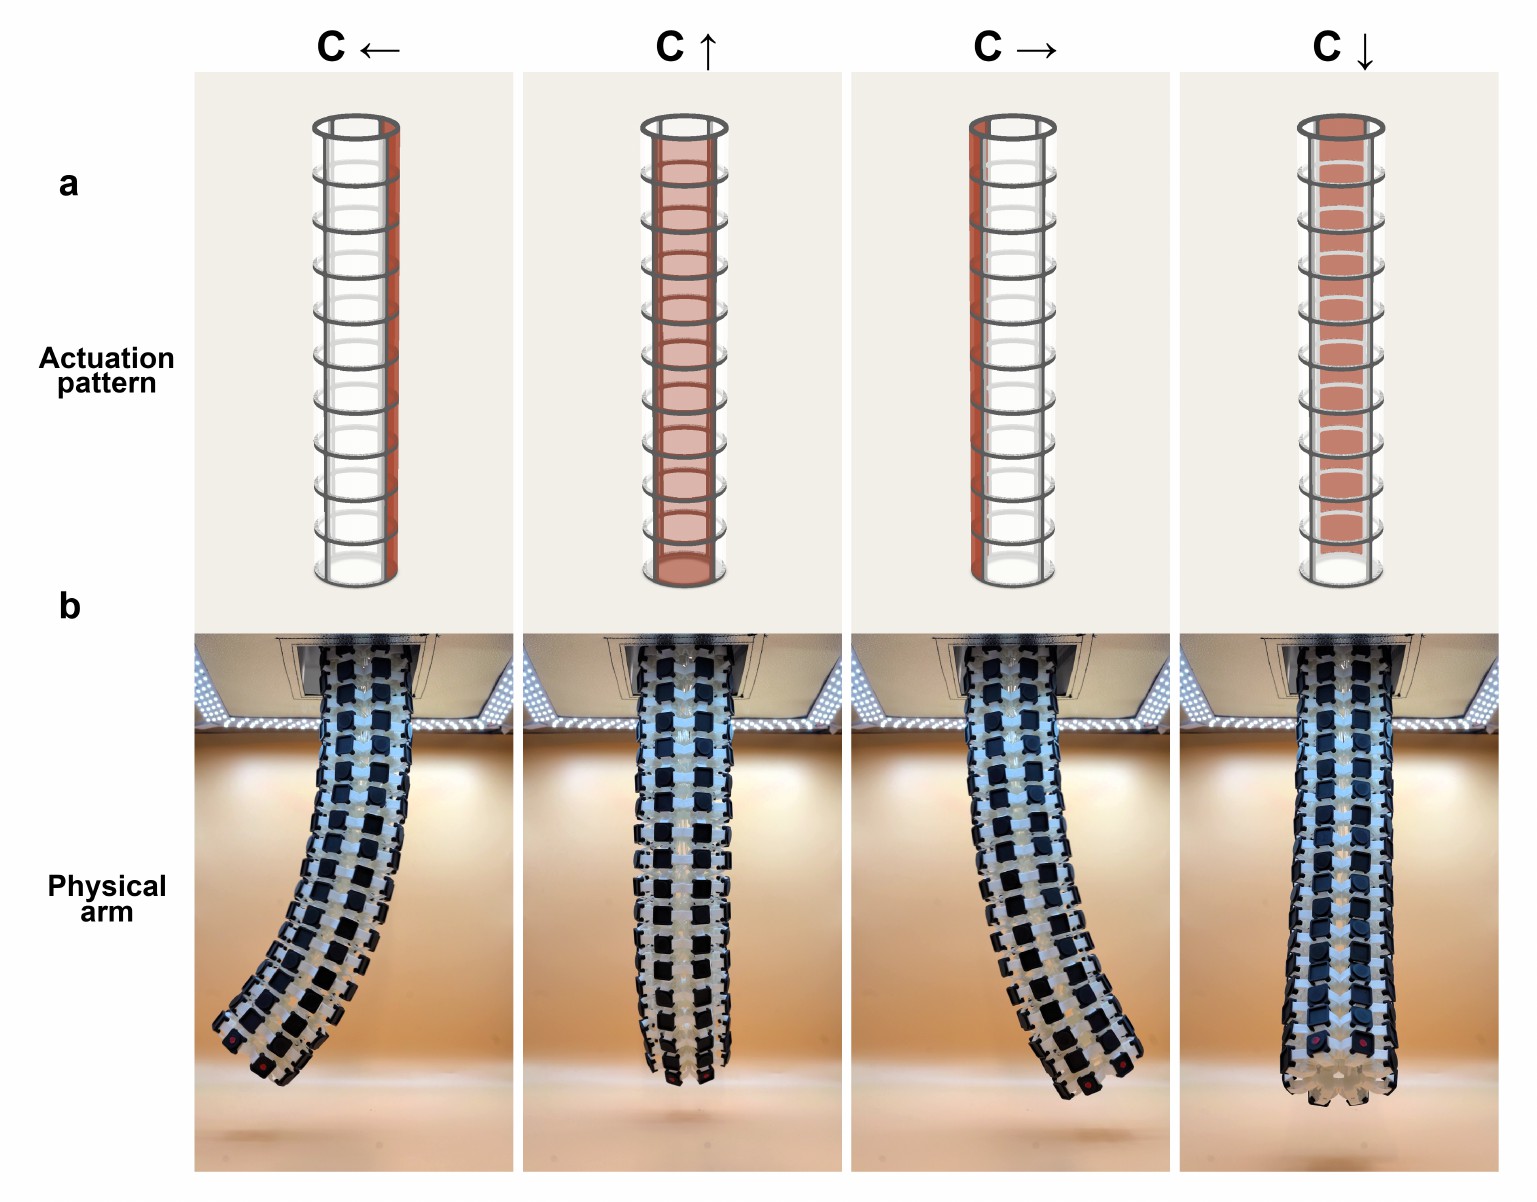
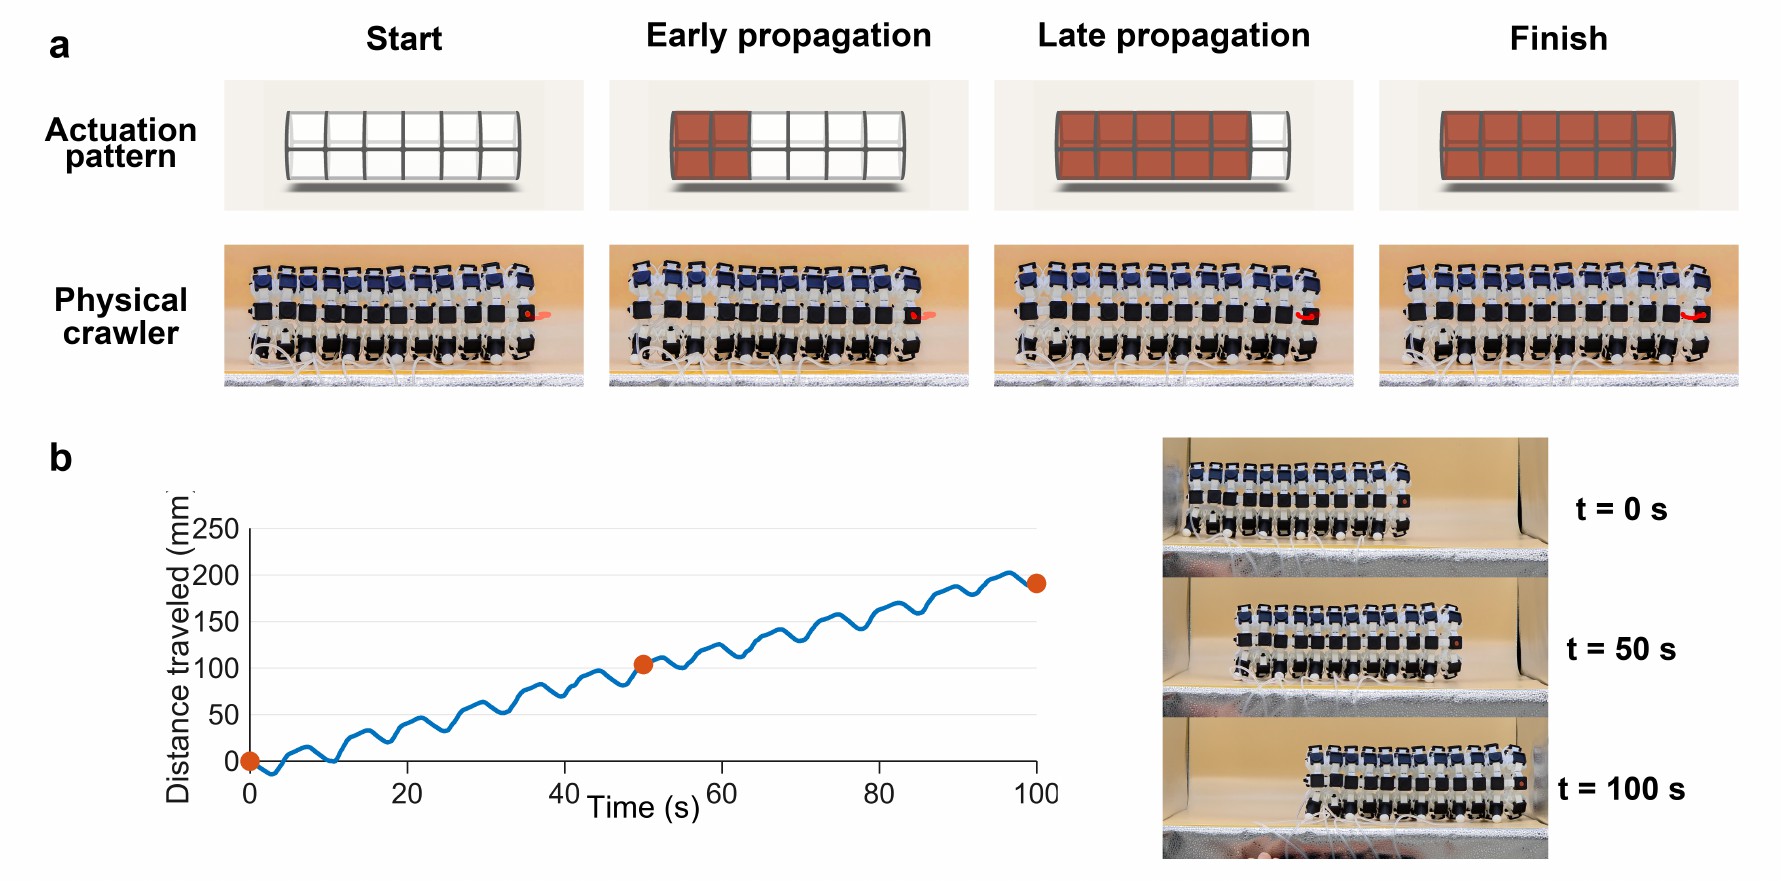
- The same cell array is wrapped into bending and locomotion assemblies.
- The selected set keeps one planar height-map panel, one object-transport panel, one cylindrical bending panel, and one crawler sequence.