Cell and module behavior
- Pressure-driven expansion rotates the compliant linkage legs while the integrated pneumatic chamber supplies deformation.
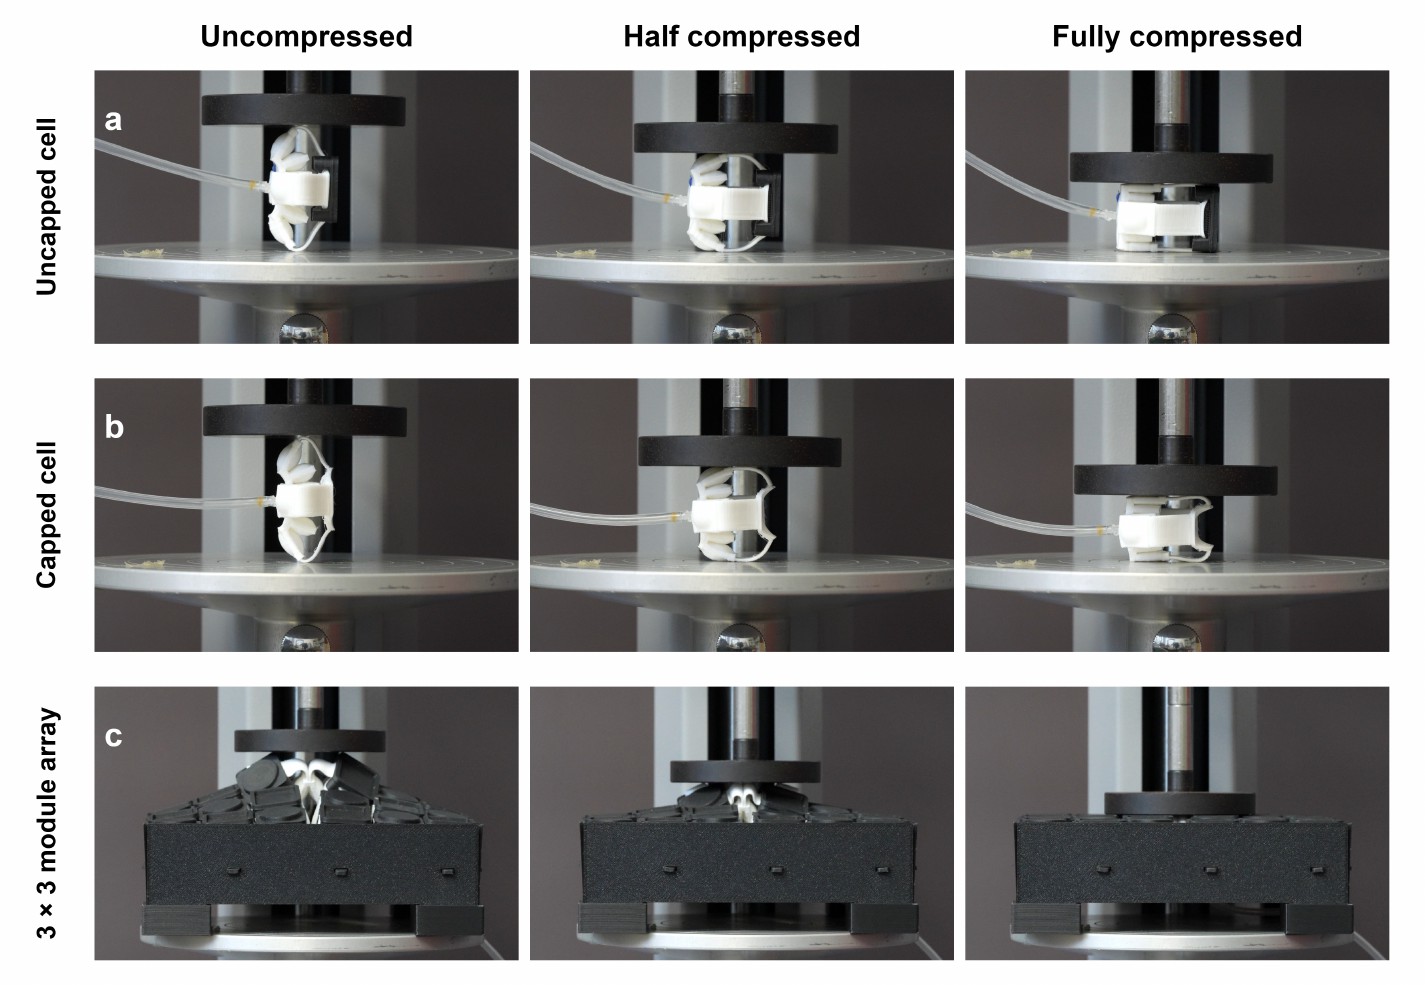
- Capped and uncapped cells are compared over the same 10-120 psi range, separating the cell expansion response from module-scale bending.
- The 2 x 2 module introduces the bending bias used later for surface shaping and cylindrical body motion.


Reported values
Figure-read estimates are kept approximate; table values are reported directly from the current paper.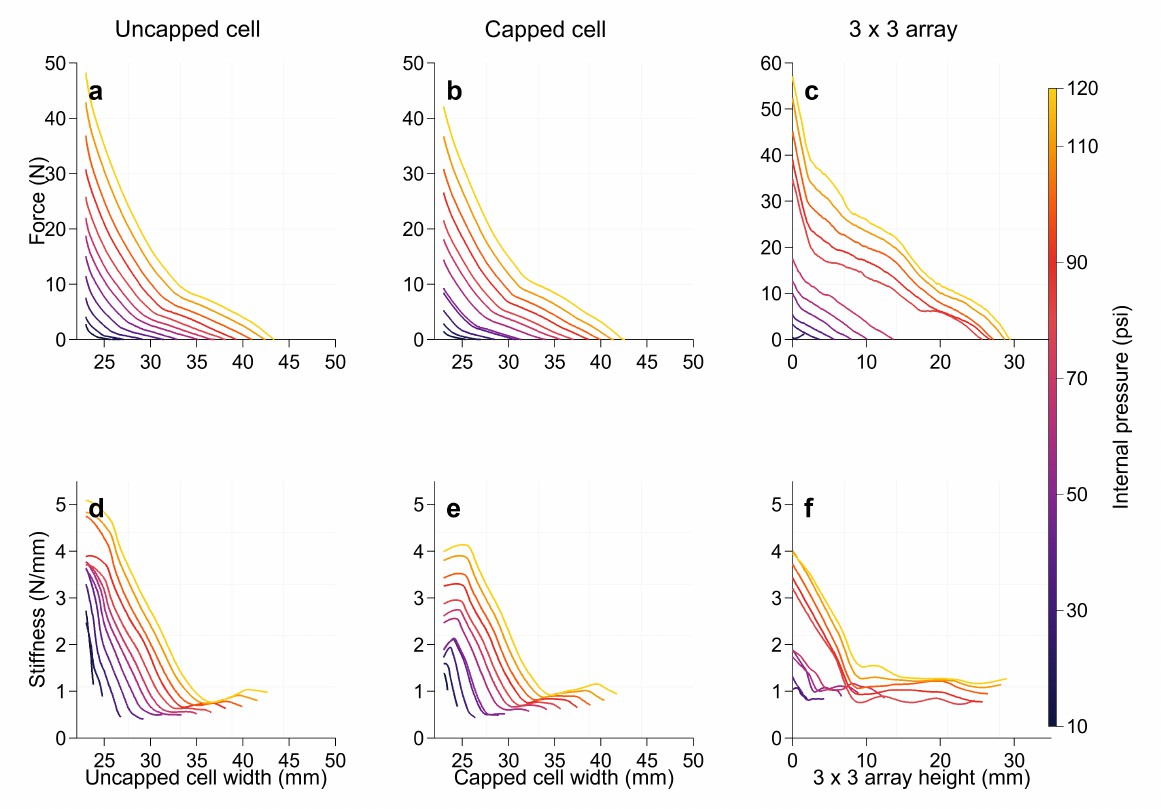
| Signal | Reported value | Source | Boundary |
|---|---|---|---|
| Actuation envelope | 10-120 psi plotted for cell expansion, module bending, hysteresis, force response, and local stiffness. | Fig. 1; Fig. 2; Fig. 4; Fig. 5 | Defines the tested pneumatic operating range on this page. |
| Cell expansion / module bending | Lateral expansion rises over the 10-120 psi range; the 2 x 2 module test separately reports single- and two-module bending angle versus pressure. | Fig. 1(c); Fig. 2(c) | Figure-read pressure response, not digitized raw data. |
| Output force | Pressure-dependent force-displacement curves reach approx. 40-50 N for single-cell tests and above 50 N for the 3 x 3 array near maximum compression. | Fig. 5(a-c) | Single-cell and array curves are kept separate. |
| Local stiffness | Computed local stiffness peaks at approx. 5-7 N/mm across cell and array plots, varying with pressure and compression state. | Fig. 5(d-f) | Computed from force-displacement response shown in the public figure. |
| Hysteresis | Pressure-dependent hysteresis is plotted for uncapped cells, capped cells, and 3 x 3 arrays; raw loop area is not yet digitized on this page. | Fig. 4 | Loop area is not digitized here. |
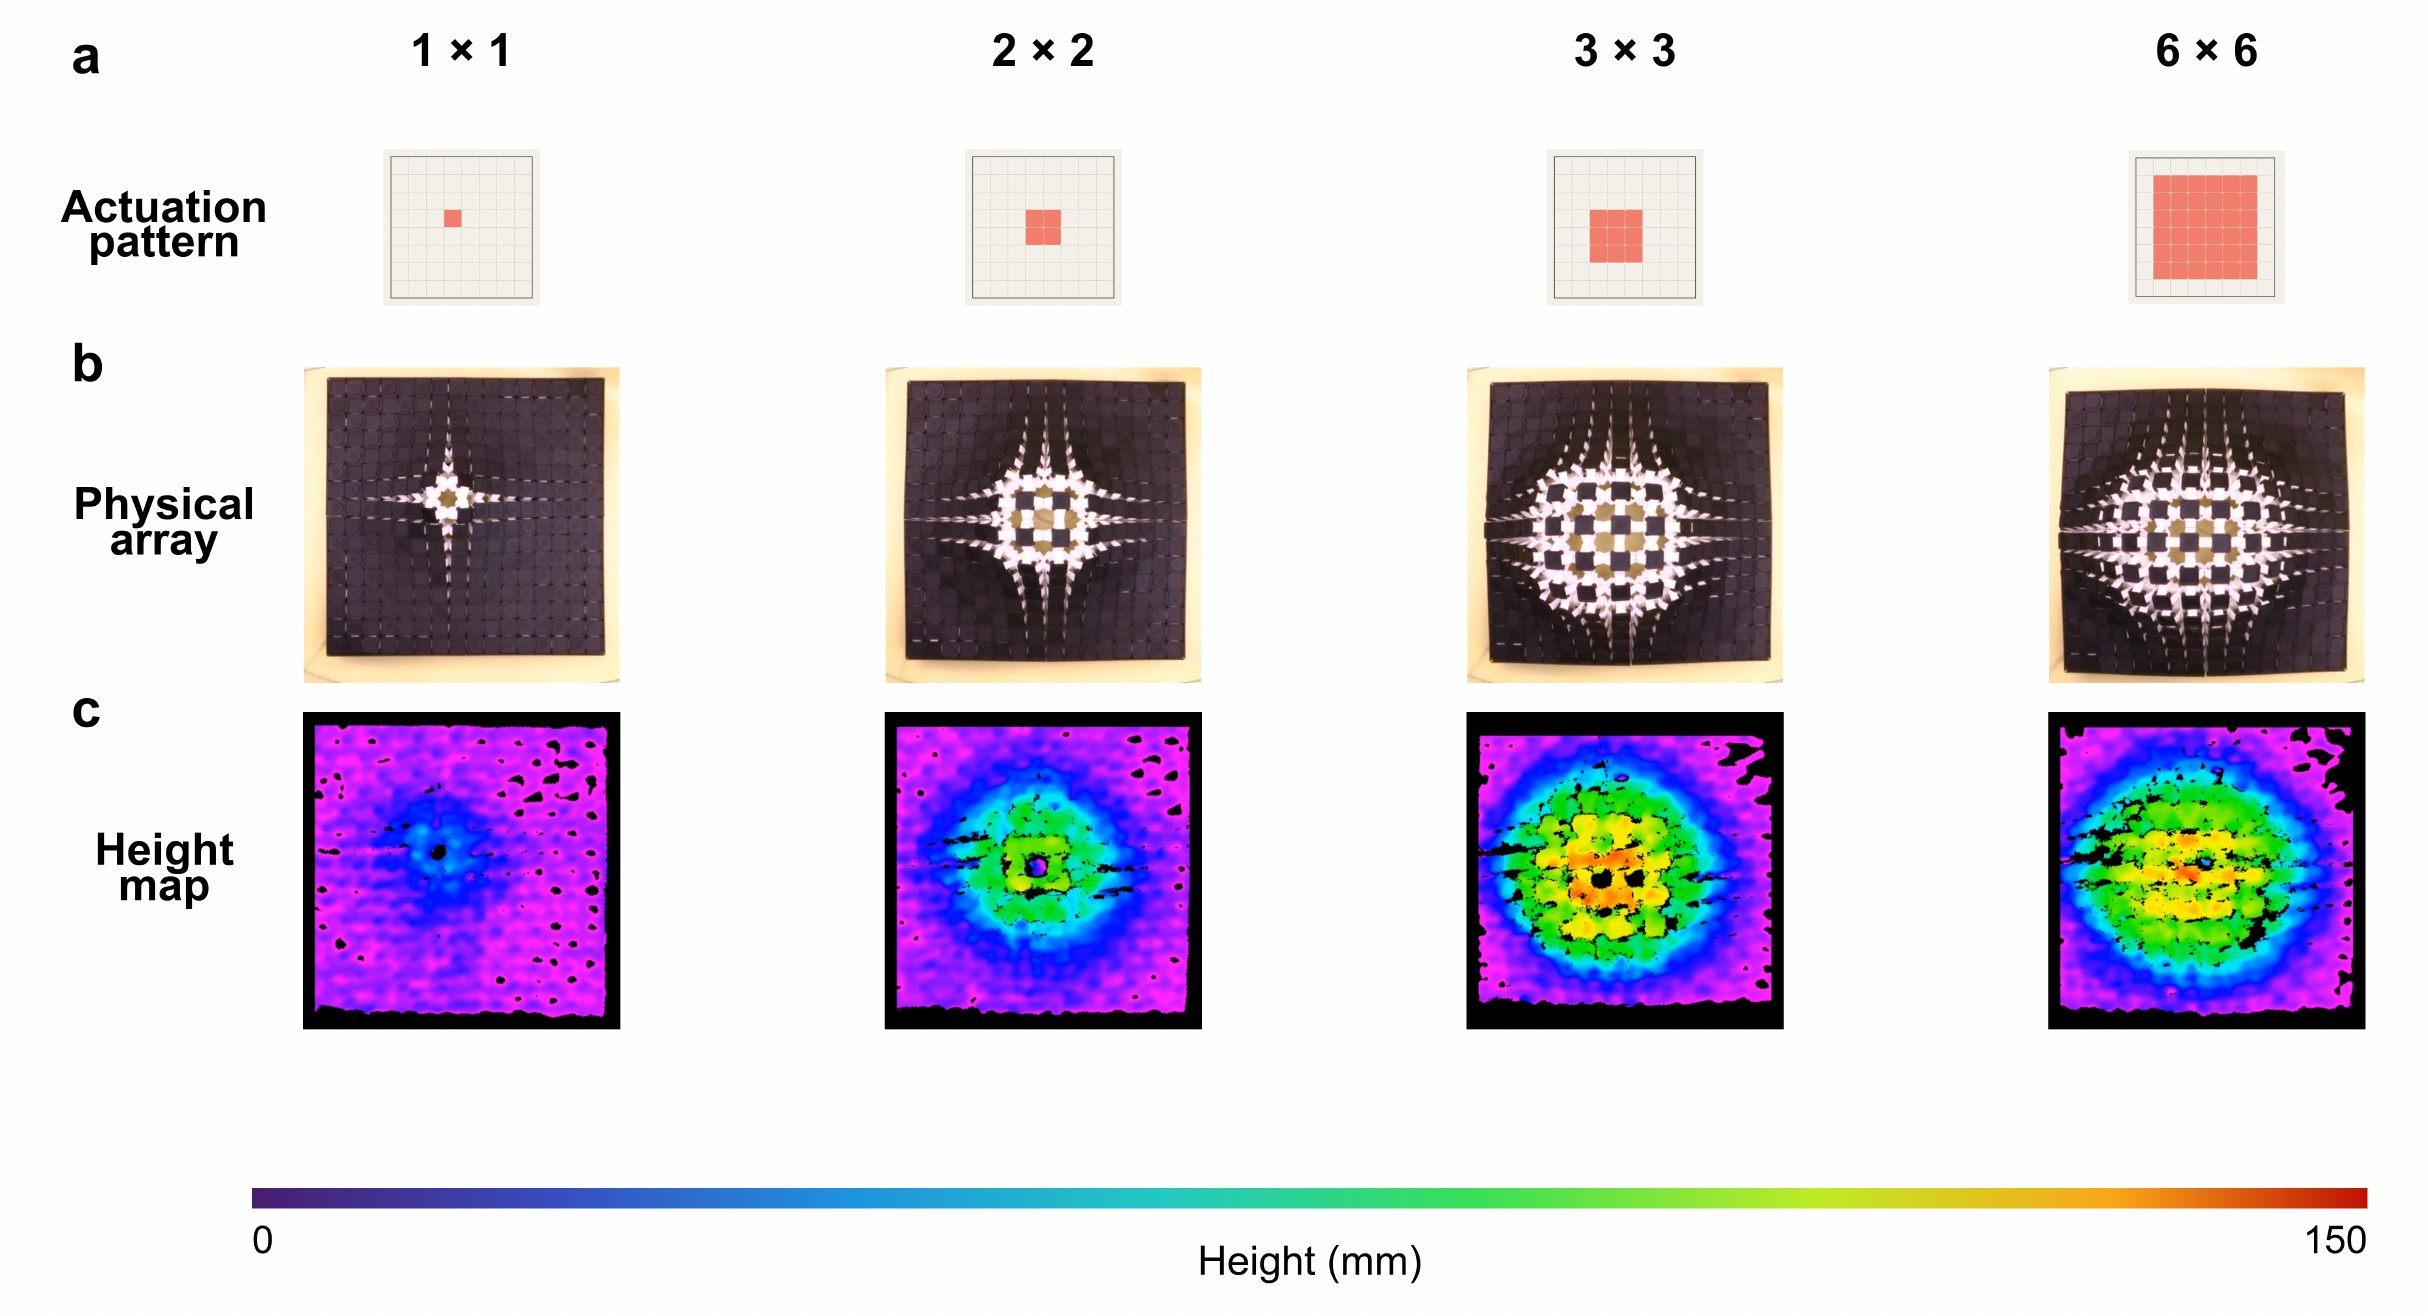
| Planar dome height | At 100 psi, 1 x 1 actuation reaches 60 mm max height; 2 x 2 actuation reaches 115 mm. | Table 1 | Direct table values. |
| Double-dome resolution | At 100 psi, adjacent 1 x 1 features merge at 60 mm; with four unactuated cells between features, separated low-amplitude peaks reach 35 mm. | Table 2 | Direct table values; separated features trade amplitude for spacing. |
| Iteration / limitation | Cap reduces top-surface gaps; 2 x 2 modules reduce tubing; current system still uses tethered pneumatic inputs and manual assembly. | Methods; Discussion | Current build constraint, not a resolved production system. |
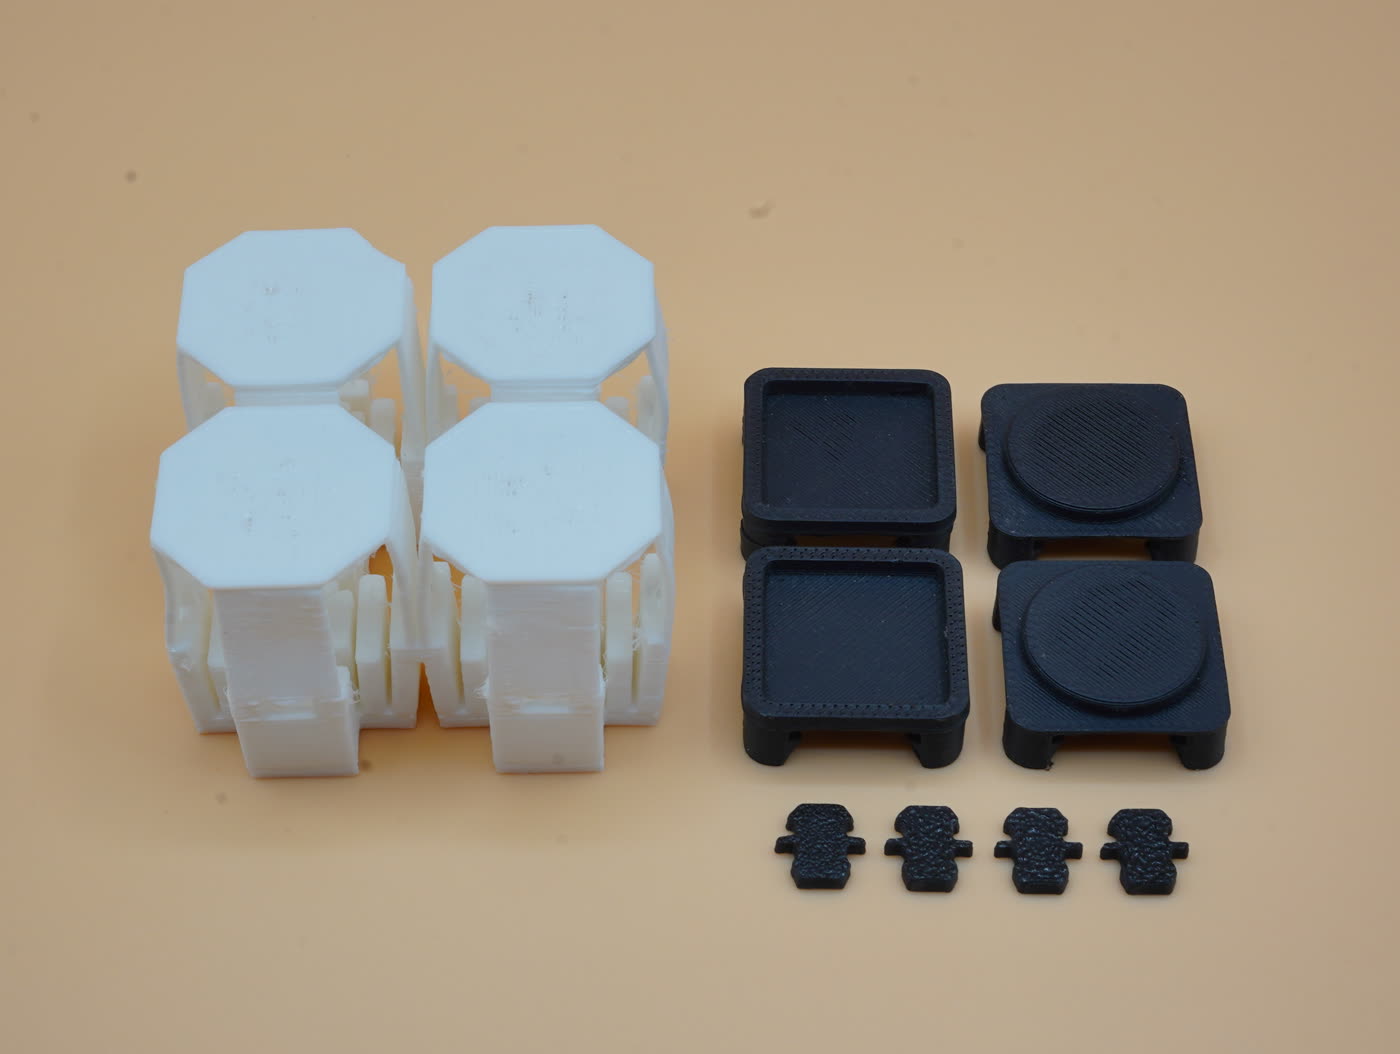
Physical module and test state
- The module photographs show the printed parts and snap-fit assembly rather than a purely rendered concept.
- Compression images document how the unit and array behave under load before the page moves to surface programs.
- The public system remains pneumatically tethered; electronically addressed actuation is still outside this build state.
Programmed surface and body motion
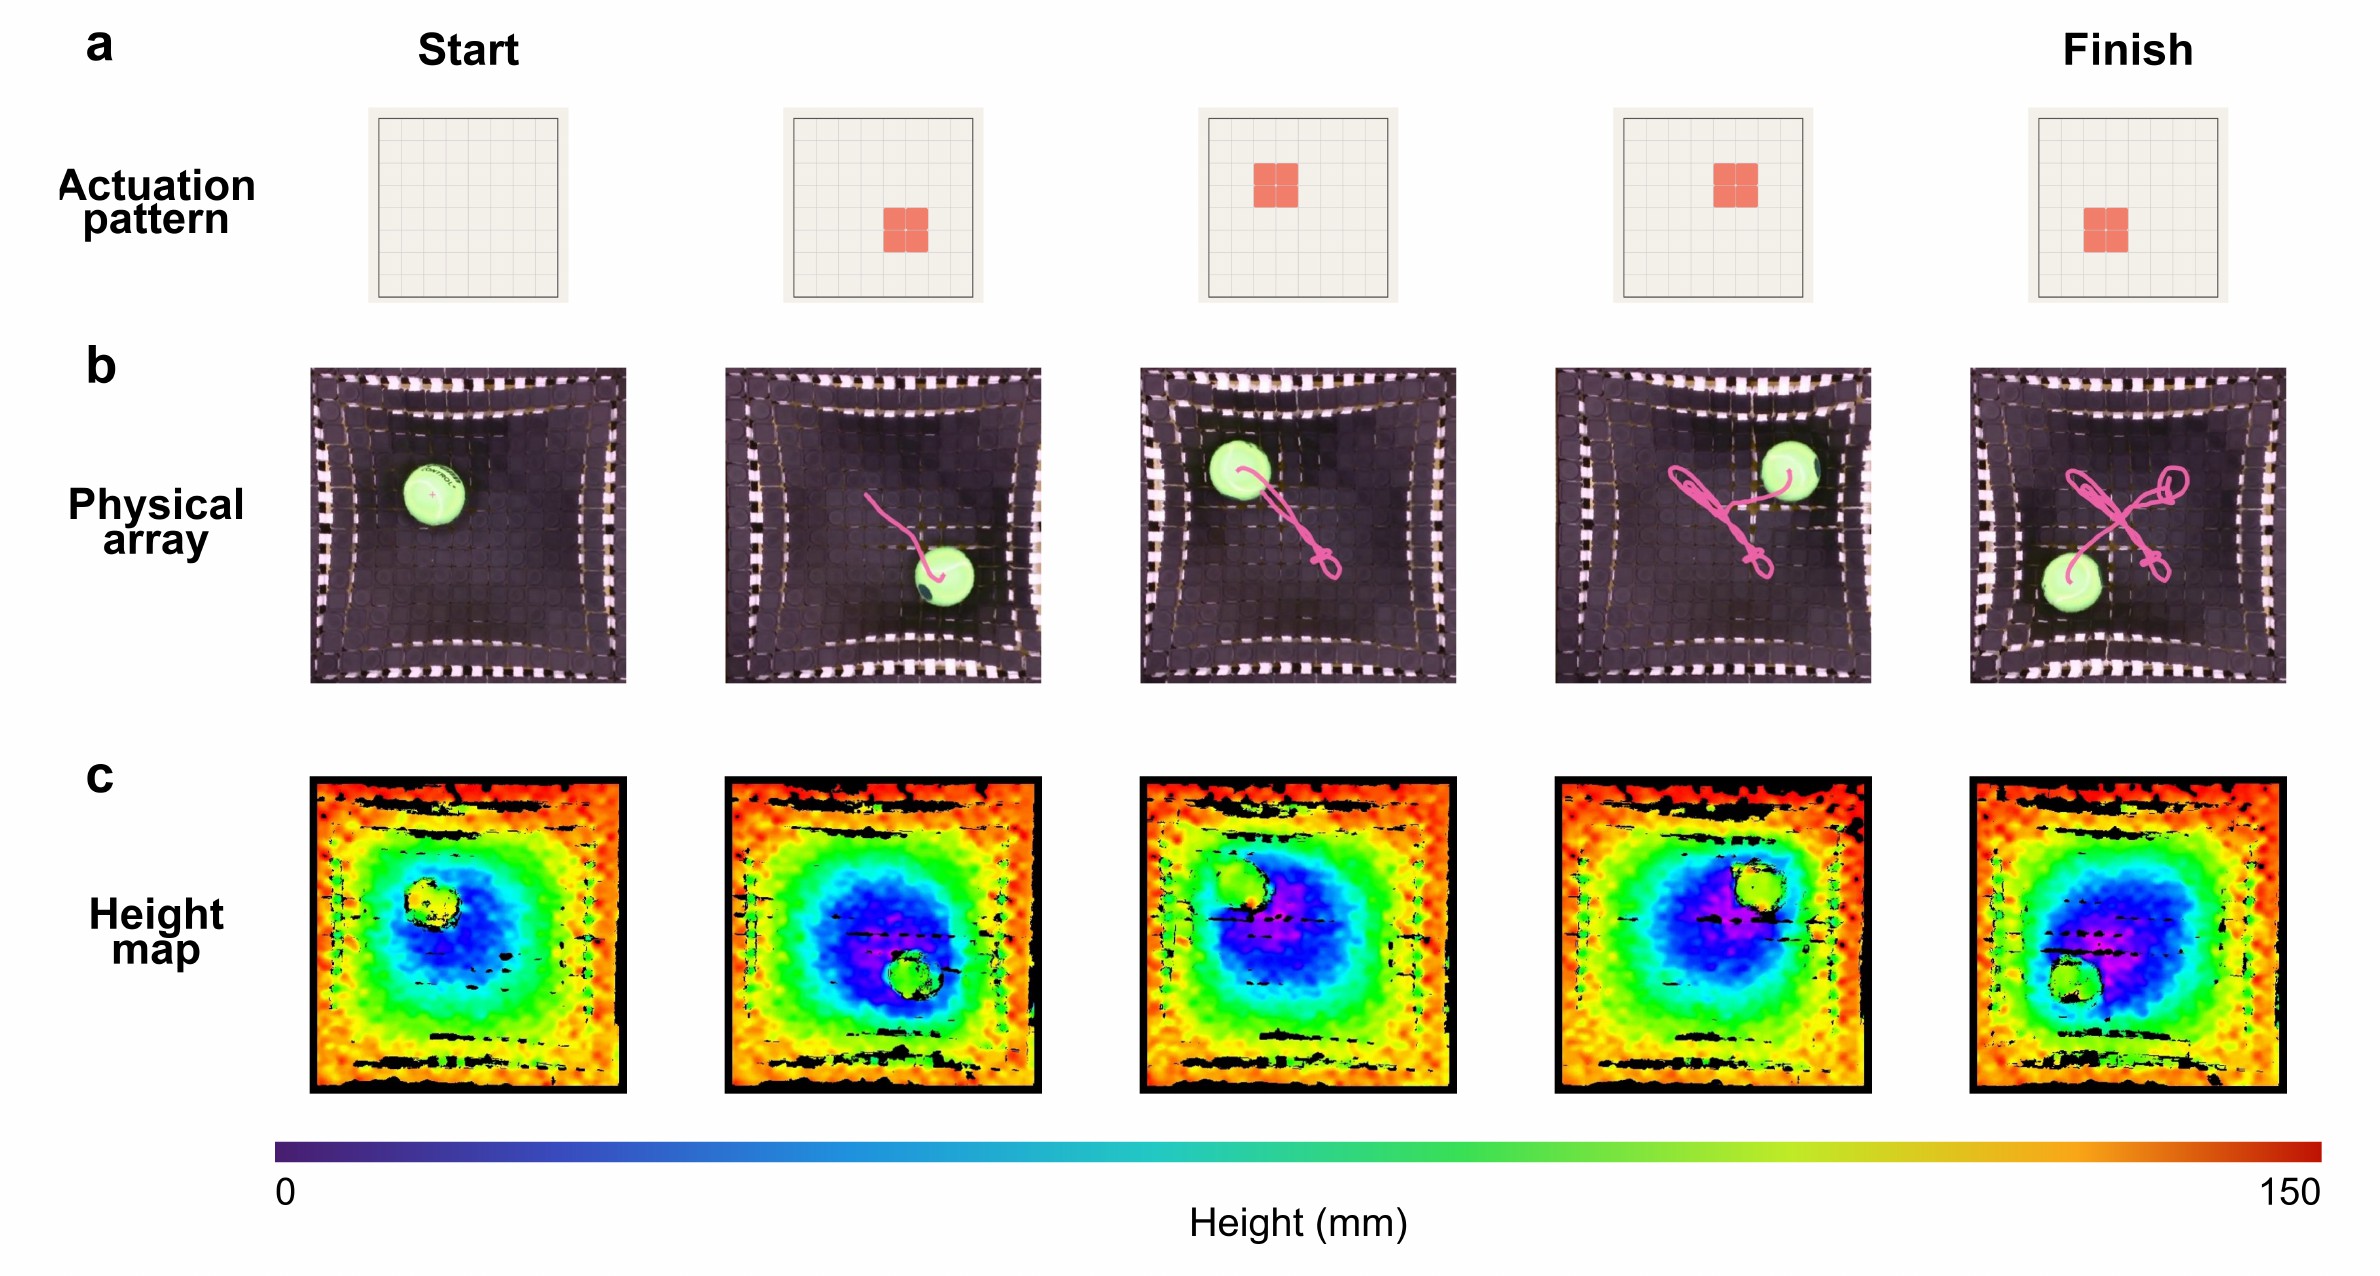
- The planar figures are limited to one height-map example and one object-transport example, instead of repeating similar wave panels.
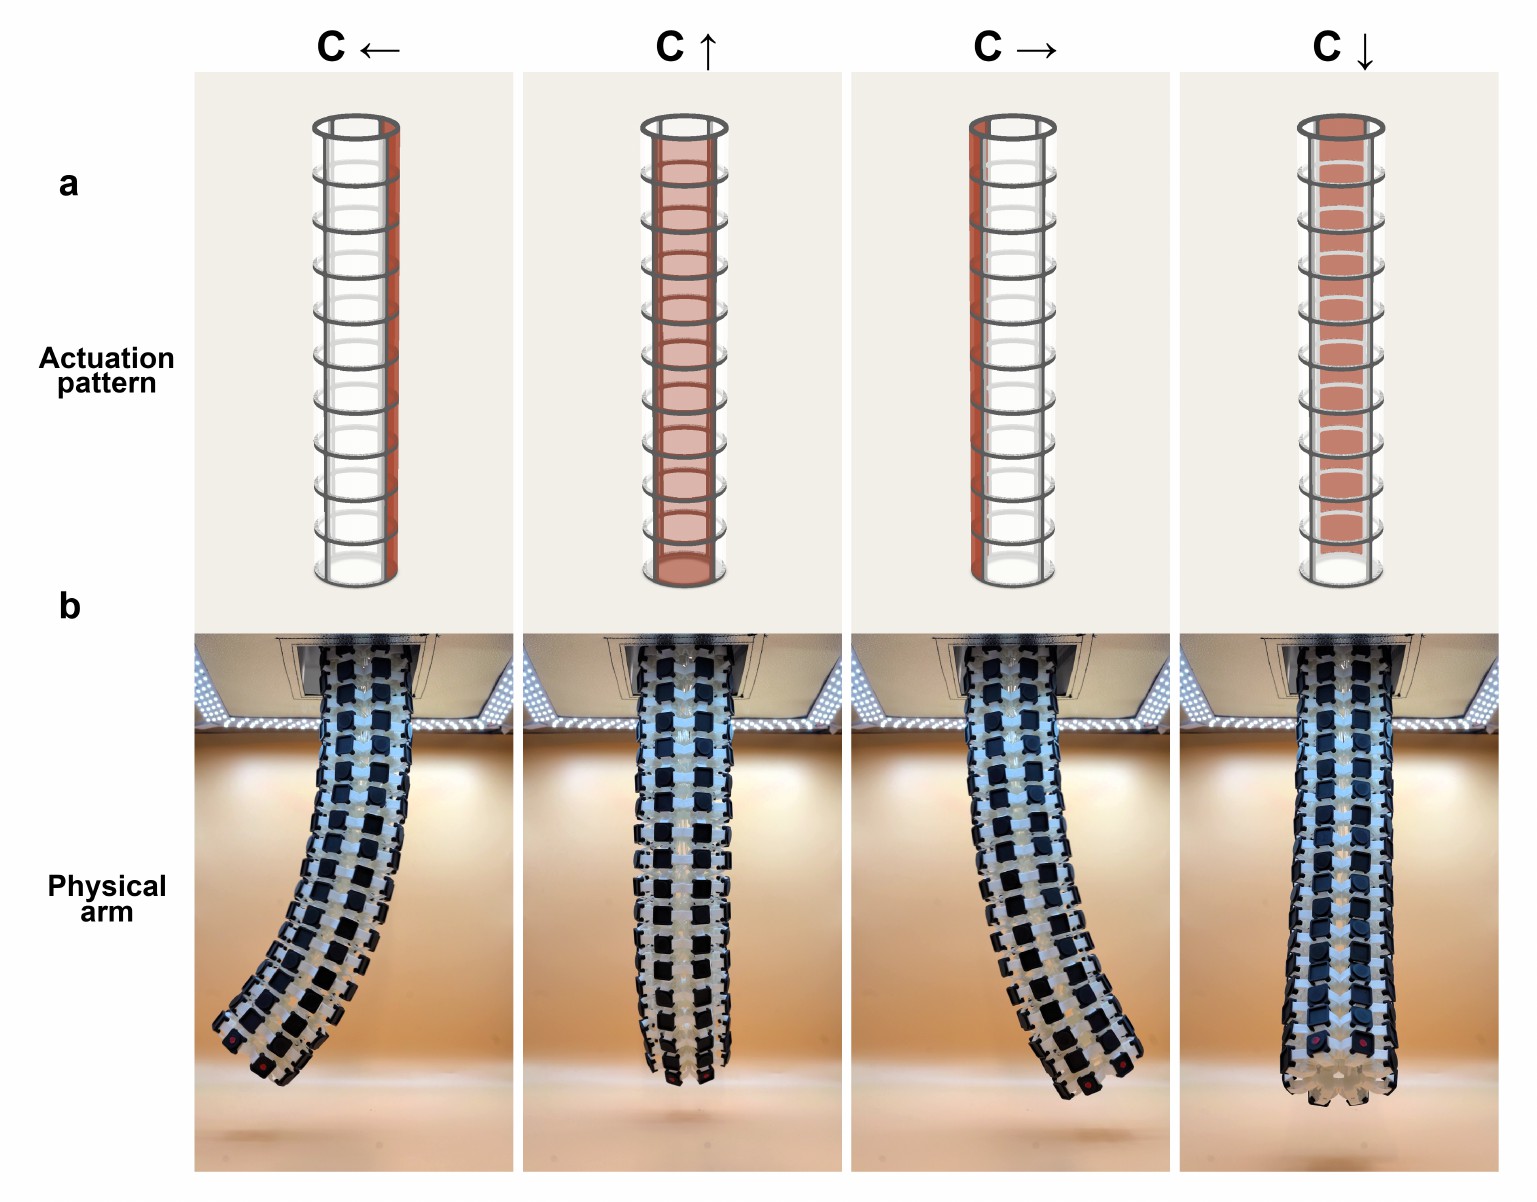
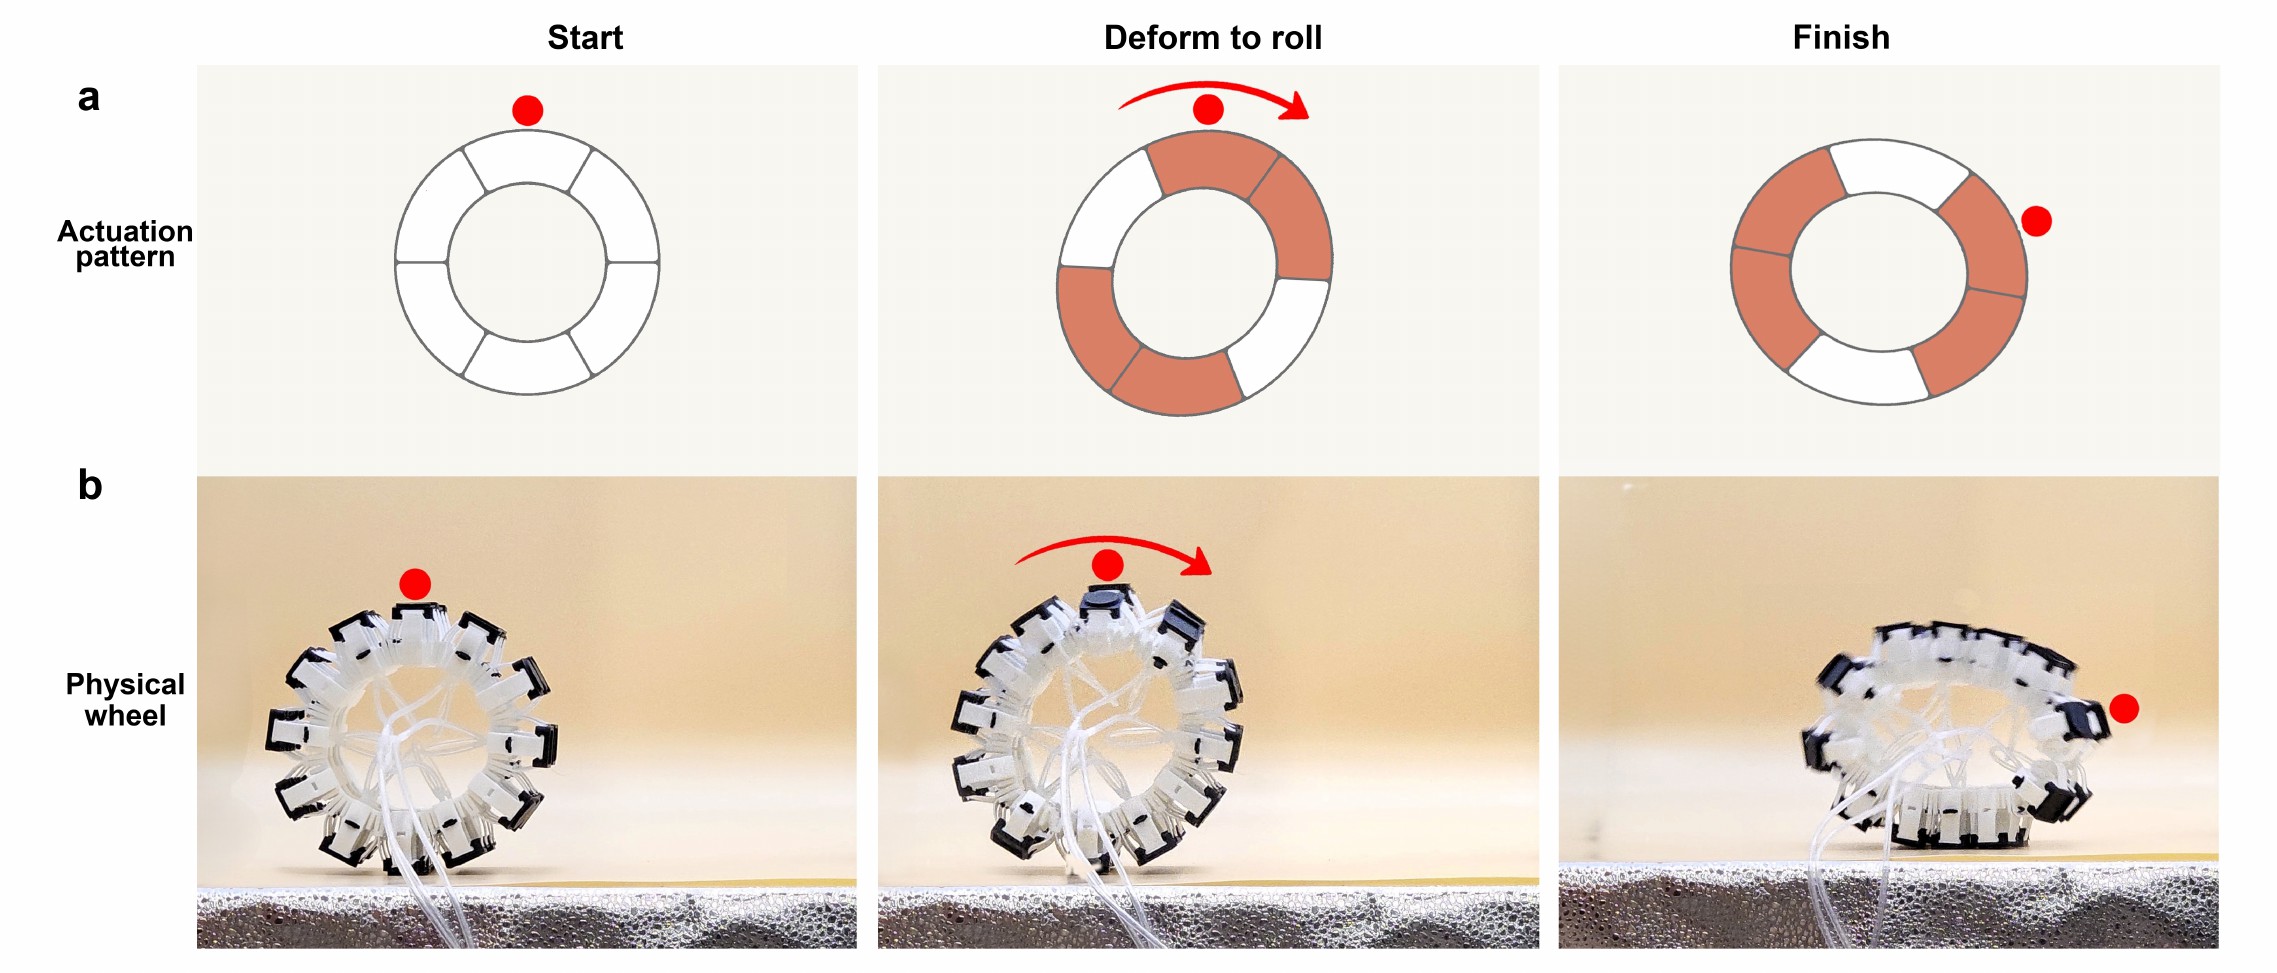
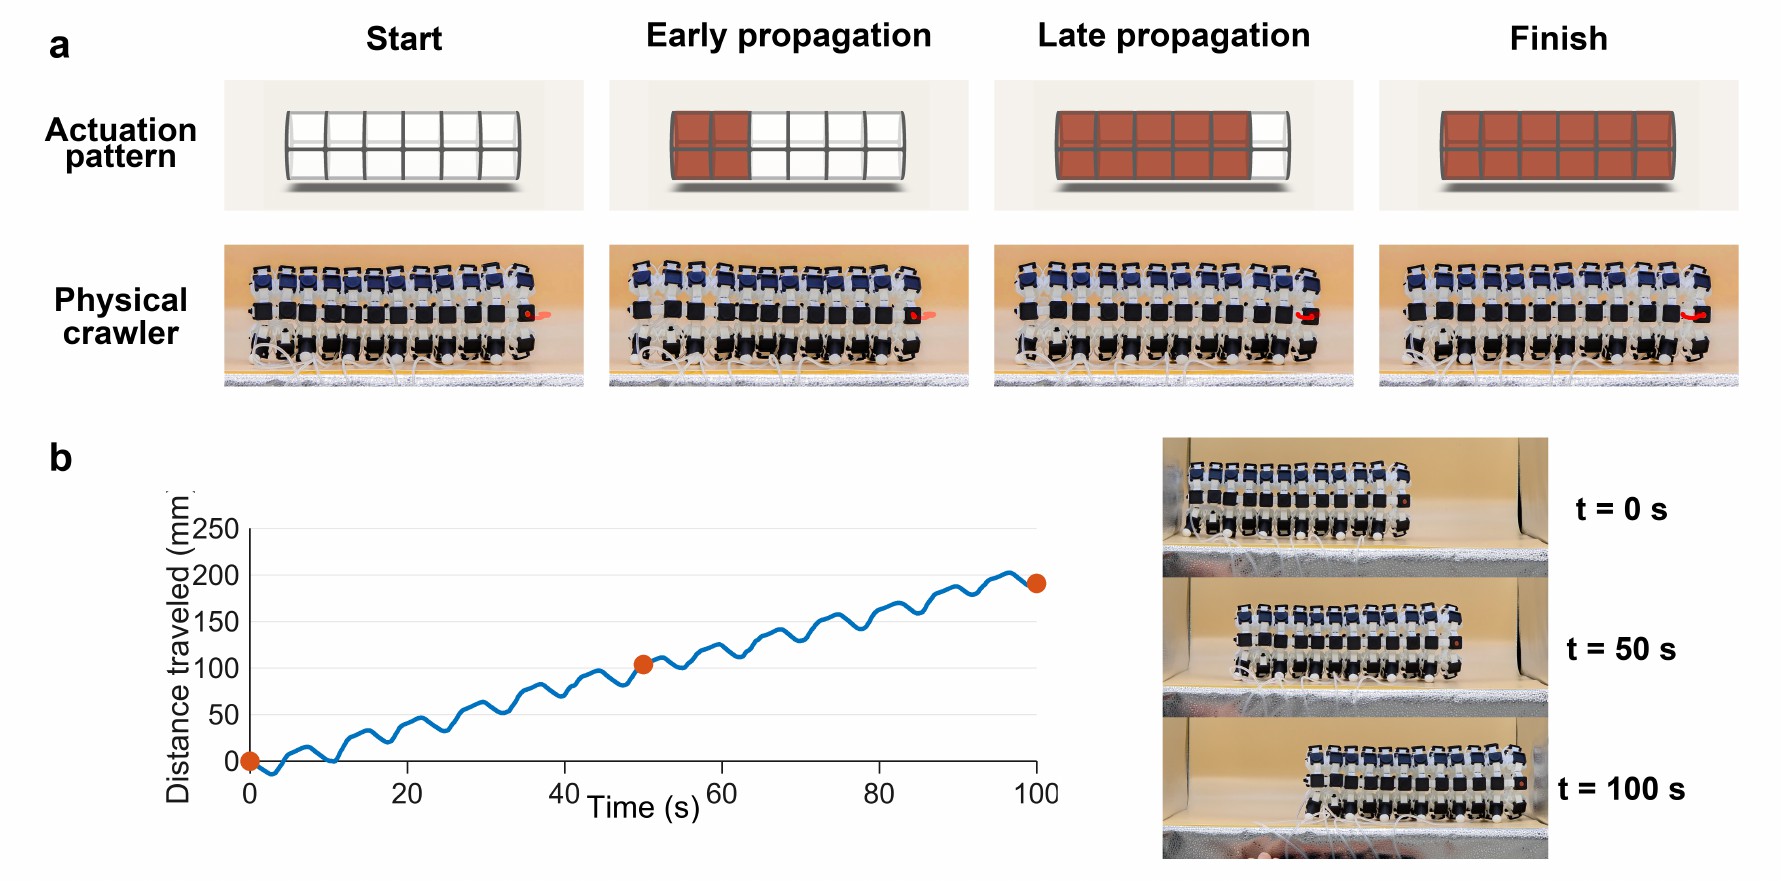
- The cylindrical figures show the same cell architecture rewrapped into bending and locomotion assemblies.
- The selected set moves from local pressure pattern to measured surface shape to body-scale motion.